For organisations · dashboard
Organisation-wide talent,
in one overview
The company dashboard brings together utilised talent and natural potential, team dynamics and development direction – always aggregated, never traceable to individuals.
The dashboard
One picture of your whole organisation
What the dashboard does
From separate scans to a working instrument
A scan produces a report. A dashboard produces a way of working. These are the six things that make the difference.
Insight
See what talent you have in house, where it grates and where there is room to develop. For the whole organisation, per team and per person.
Structure
No loose reports and lists. Profiles, teams and role profiles sit together in order, so you can steer instead of search.
Reporting to measure
Reports that match your question, with your competencies and in your house style. For HR, management or the board.
One place
All scan data together. Everyone works from the same picture, with access that matches their role.
Aime as AI coach
Aime turns insight into action: personal feedback, a development plan and coaching for every participant, at any moment.
Linking coaches
Link a certified coach to a participant or a team, without having to find someone yourself.
Who sees what
One measurement, four ways of looking
The scan is taken once, by the employee. What you see afterwards depends on your role: your own profile, your team, the cross-section of the organisation or the whole. Each layer has its own picture, its own decisions and its own boundary.
Layer 1 · the employee
Your profile is yours
You see your own nature and culture, how much tension and load there is, where your effort comes from your own strength and how well your role suits you. You can talk it through with Aime and draw up a development plan alongside it.
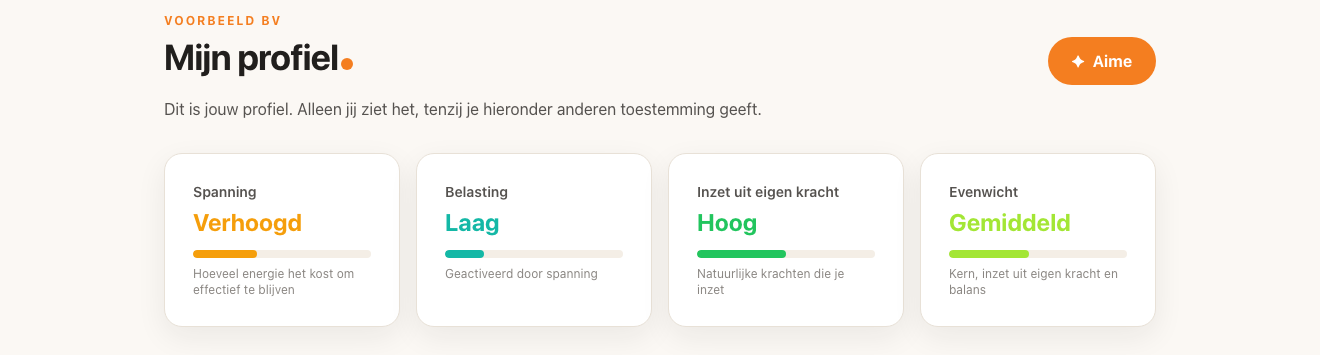
What you do with it. You set your own development direction and hold the conversation with your manager on your own terms, with something concrete on the table.
What you do not see. Anyone else’s profile, your manager’s included. The dashboard says so itself: only you see your profile, unless you give consent per section. What the me.scan does for you personally →
Layer 2 · the team leader
How your team is put together
You see your team’s group figures: balance, agency and communion, resistance sensitivity and the distance to what the roles ask. You can raise the pressure and see what changes. Each figure comes with a question to discuss in the team.
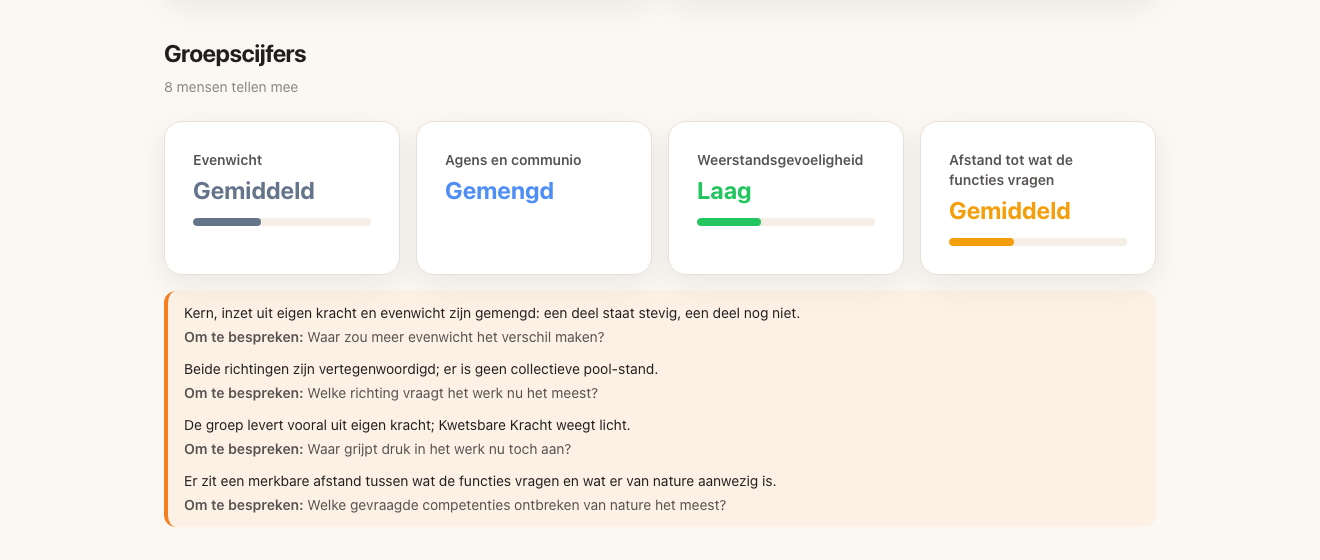
What you do with it. Adjust the division of roles and tasks, hold the team conversation with something other than gut feeling, and put a new colleague in the place where they fit.
What you do not see. Individual reports only from team members who gave you consent. Group figures appear only from three people upwards. The team layer in full →
Layer 3 · HR
The same figures side by side
You see the cross-section of the organisation: per team and per role profile the effort from own strength, the load, the fragile strength and the fit with the role. And you see where role profiles structurally ask for more than is naturally present.
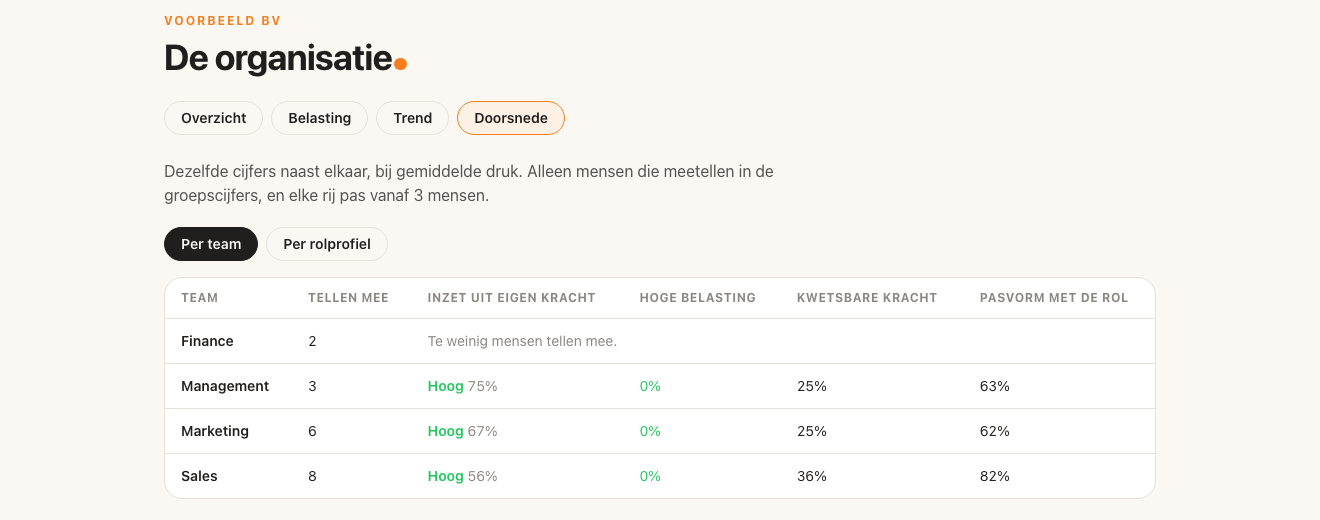
What you do with it. Underpin mobility and succession, spend the training budget where it counts, and answer per role the question: do we bring this in or develop it?
What you do not see. Teams below the threshold get no figure. In the example above Finance has two people, and the dashboard says plainly that this is too few. The HR layer in full →
Layer 4 · the board
The whole picture, and the pressure at which it tips
You see the organisation in four readings, the load per pressure level and the trend over time. Not only where things stand now, but at what pressure they tip. That tipping point is the figure you can steer on.
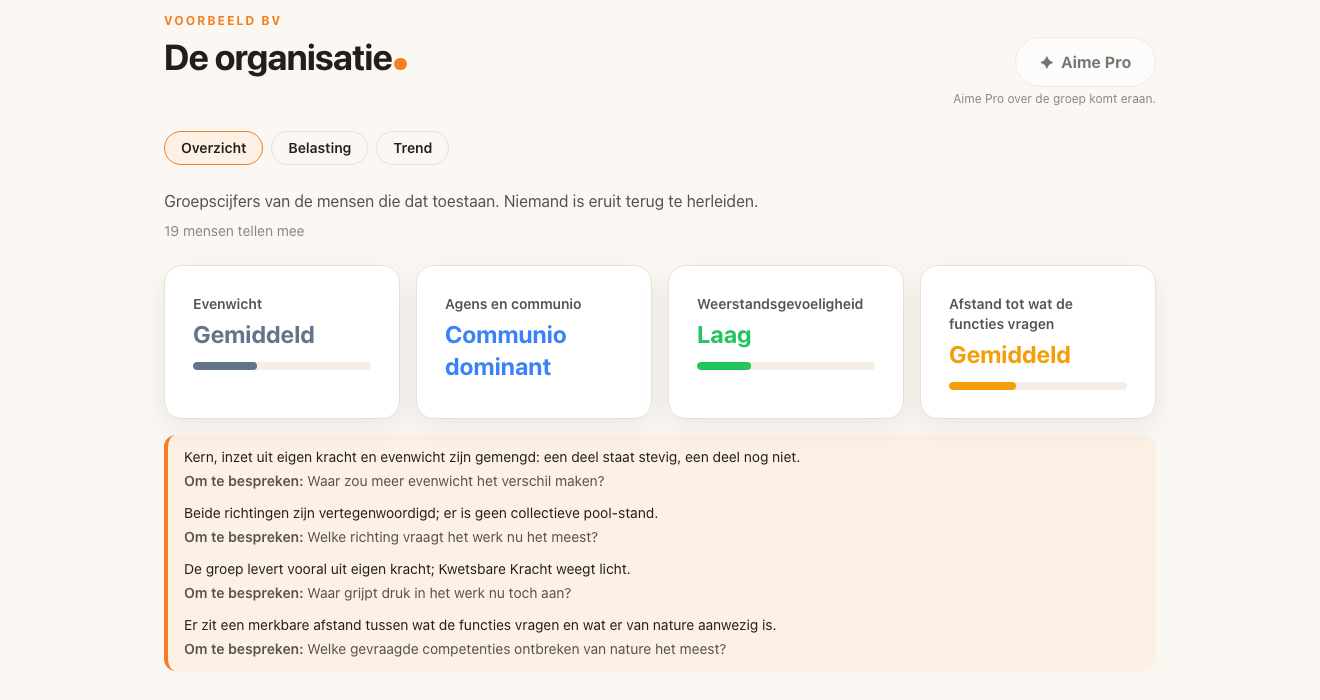
What you do with it. Strategic workforce planning, reorganising on facts instead of assumptions, and investment decisions you can explain.
What you do not see. No names, no individual profiles, and never a figure that can be traced back to one person. The board layer in full →
What it delivers
From insight to result
The dashboard does not show scores but answers to the questions a board asks. This is what those answers bring you.
Less staff turnover
You see where tension builds as pressure rises, and in which team. That is visible before anyone hands in their notice, so you can still do something about it.
Higher productivity
You see which part of the talent present is being used and which part lies idle. People who work from their natural strength deliver more and have energy to spare.
A better division of roles and tasks
For each role you see whether someone fills it from natural strength or from effort. That turns shifting tasks into a well-founded conversation instead of a guess.
More strategic HR policy
Nature, culture and intended direction sit side by side, at organisation and team level. You steer on the whole instead of on incidents, and that takes tension out of the organisation.
All of this insight is aggregated. You see patterns per team and per organisation, never the profile of an individual employee; that remains the employee’s own.
Executive mode
Five questions, five answers
The dashboard opens with the questions a board asks. Each card clicks through to the underlying evidence.
Where does it get heavy, and from when?
At average pressure the group stands firm; at high pressure it concerns 2 of the 19. The tipping point lies between high and extreme.
Are we using the talent we have?
Almost everyone already puts their preferences to work. But 30% of what is delivered comes from fragile strength, and that costs energy.
Do people fit where we want to go?
11 of the 19 fill their role without a blind spot. For the other eight, the role asks for something that is not naturally there.
How are our teams composed?
All eight archetypes are present as natural strength. Strongest is People-oriented, followed by Contact-oriented and Responsible.
How is our leadership filled?
Strongest in Visionary. No natural strength in People-oriented, Solution-oriented, Factual and Contact-oriented.
Five questions, five answers. Insight is always aggregated; individual profiles only with the employee’s consent.
How it goes
From kick-off to a working dashboard
Four steps. Not an implementation project of months, but a set-up that stands in a few weeks.
Step 1
Kick-off
We discuss the goal and what is needed to start well. Who takes part, which teams, and what you want to get out of it.
Step 2
Inviting
Participants receive an invitation with a short introduction from Aime and fill in the scan. That takes about twenty minutes.
Step 3
Mapping role profiles
We convert your job descriptions into role profiles in the me.scan. You check them before they count.
Step 4
Getting started
The results come in and we explain how to use the dashboard. From that moment it works.
You measure talent once; that picture is stable. How that talent is put to work you then follow with the annual update, and that is in every plan.
See your organisation
like never before
In a demo we show what the dashboard can mean for your organisation.
What it costs depends on your size and on what you want alongside it. See the plans for organisations or work it out directly in the quote calculator.