Company dashboard · HR
The same figures side by side
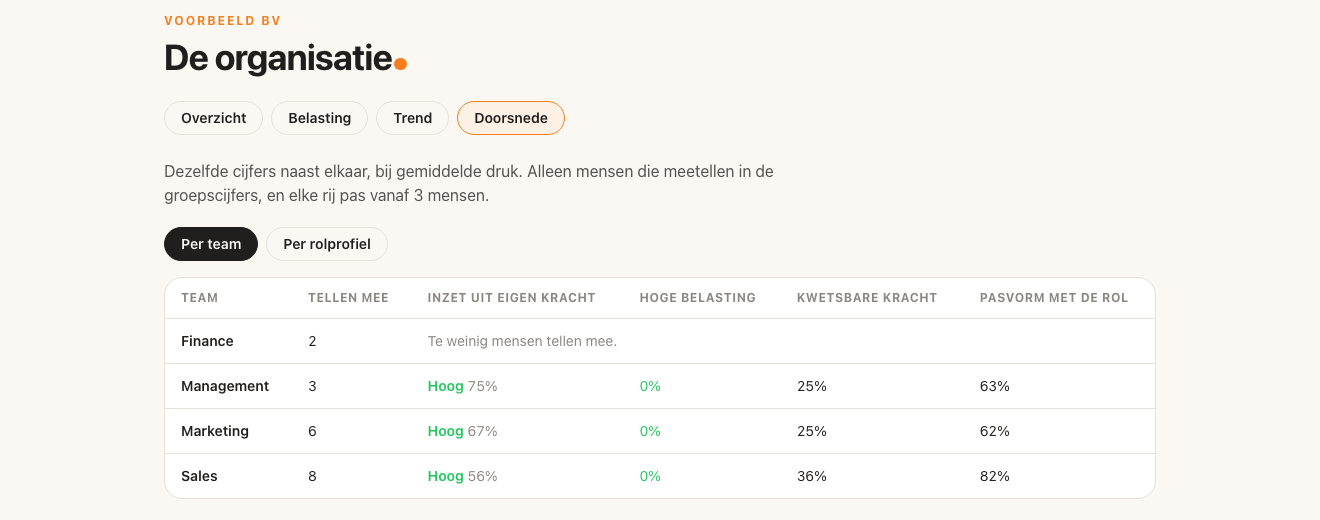
You know which teams need attention, but not always why, and certainly not whether it differs from one team to the next. The cross-section puts every team and every role profile on the same measure.
What you see
The cross-section across the organisation
Per team and per role profile: how much is delivered from own strength, how many people carry a high load, how much fragile strength is in it and how the fit with the role stands. All at the same pressure level, so the comparison holds.
Roles
Where the role asks for more than there is
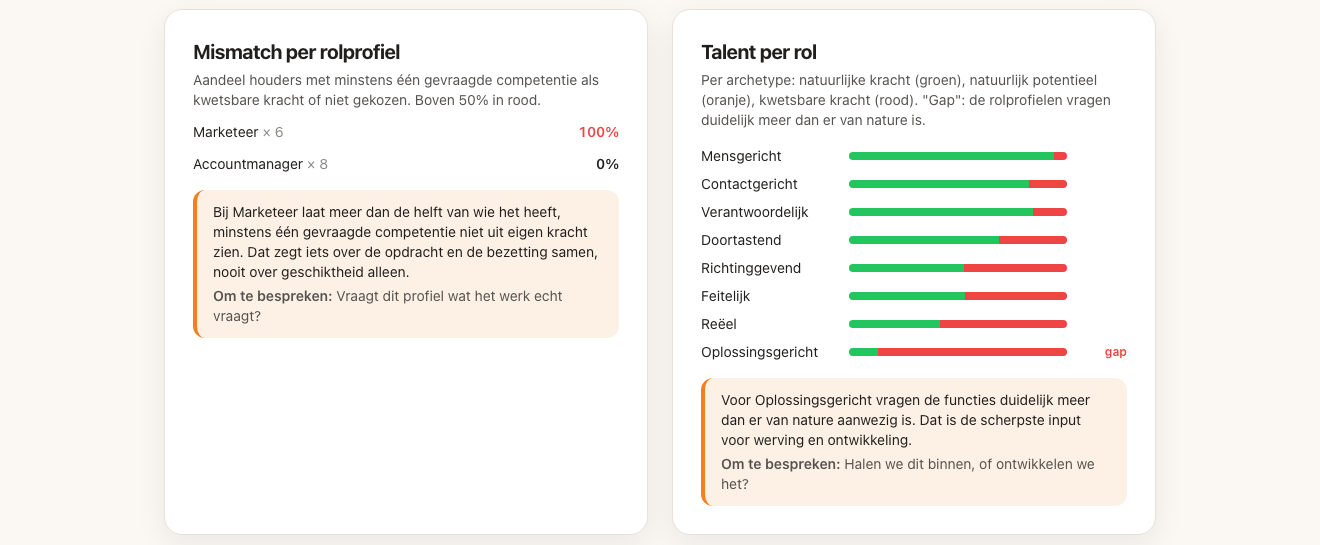
Per role profile you see what share of its holders does not deliver a required competency from own strength. And per archetype whether the role profiles together ask for more than is present in the organisation. That last one is the sharpest input for recruitment and development you can have.
What you do with it
Policy with an evidence base
The cross-section changes the question from “who complains loudest” to “where is the pattern”.
Mobility
See where talent sits that would do better elsewhere, before someone leaves of their own accord.
Succession
Know which roles structurally ask for more than is naturally there, and who can grow into them.
Training budget
Spend it where it makes a difference, instead of spreading it thin across the board.
Buy or build
Answer the question per role profile: do we bring this in, or do we build it?
The boundary
What you do not see
Each row appears only from three people who count. A team smaller than that gets no figure, and the dashboard says so: too few people count. That is not a limitation we work around, it is the reason employees take part. You see individual reports only from people who explicitly gave HR consent.
See what your organisation has in house
Request a demo on your own data, or look at another role first.
What it costs depends on your size and on what you want alongside it. See the plans for organisations or work it out directly in the quote calculator.